For the complete experience, please enable JavaScript in your browser. Thank you!

  • Creative Cloud
  • Photoshop
  • Illustrator
  • InDesign
  • Premiere Pro
  • After Effects
  • Lightroom
  • See all
  • See plans for: businesses photographers students
  • Document Cloud
  • Acrobat DC
  • eSign
  • Stock
  • Elements
  • Marketing Cloud
  • Analytics
  • Audience Manager
  • Campaign
  • Experience Manager
  • Media Optimizer
  • Target
  • See all
  • Acrobat Reader DC
  • Adobe Flash Player
  • Adobe AIR
  • Adobe Shockwave Player
  • All products
  • Creative Cloud
  • Individuals
  • Photographers
  • Students and Teachers
  • Business
  • Schools and Universities
  • Marketing Cloud
  • Document Cloud
  • Stock
  • Elements
  • All products
  • Get Support
    Find answers quickly. Contact us if you need to.
    Start now >
  • Learn the apps
    Get started or learn new ways to work.
    Learn now >
  • Ask the community
    Post questions and get answers from experts.
    Start now >
    • About Us
    • Careers At Adobe
    • Investor Relations
    • Privacy  |  Security
    • Corporate Responsibility
    • Customer Showcase
    • Events
    • Contact Us
News
    • 3/22/2016
      Adobe Summit 2016: Are You An Experience Business?
    • 3/22/2016
      Adobe Announces Cross-Device Co-op to Enable People-Based Marketing
    • 3/22/2016
      Adobe and comScore Advance Digital TV and Ad Measurement
    • 3/22/2016
      Adobe Marketing Cloud Redefines TV Experience
API Manager Help / 

Administrator

Adobe Community Help


Products Affected

  • ColdFusion 2016

Contact support

 
By clicking Submit, you accept the Adobe Terms of Use.
 

In this article

  • Logging in to the administrator portal
  • Changing the header logo and title
  • Specifying server settings
  • General
  • API Datastore
  • API Analytics Server
  • Specifying security settings
  • Configuration
  • User Store
  • Adding users
  • Configuring SLAs
  • Adding an SLA
  • Editing an SLA
  • Viewing cluster information
  • Caching
  • ColdFusion discovery server
  • Configuring notifications
  • Configuring mail settings
  • Configure log
  • Viewing the analytics dashboard
  • Creating a visualization
  • Show All Show less

The administrator portal is a platform to manage and administer properties and functionality of the ColdFusion API Manager. Through the administrator portal, you can manage all published APIs, and their functional and non-functional information.

As an administrator, you can perform the following tasks:

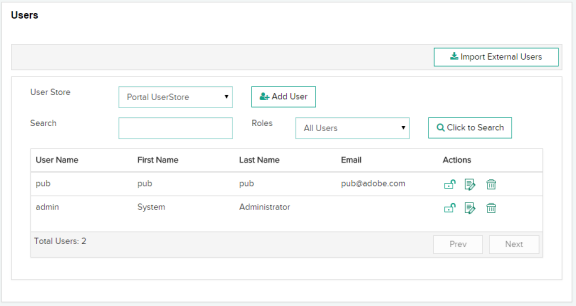
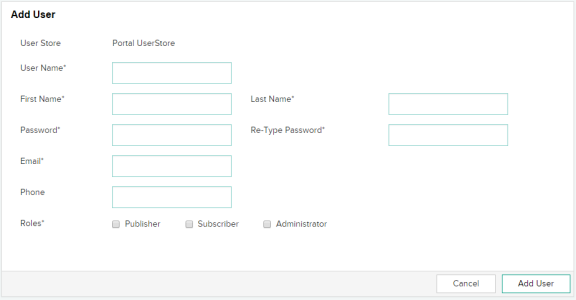
  • Add and manage all users and their roles with respect to single or multiple published APIs.
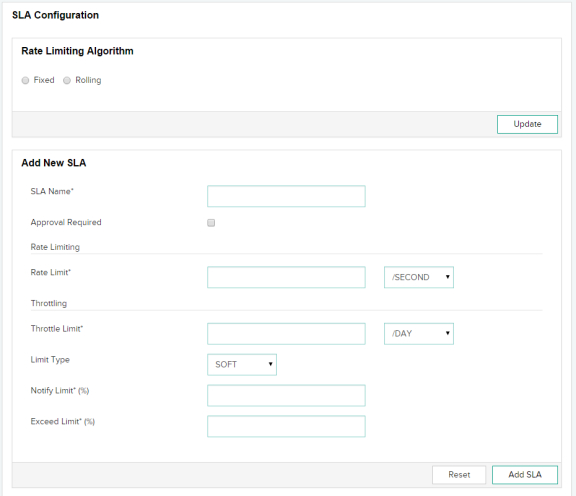
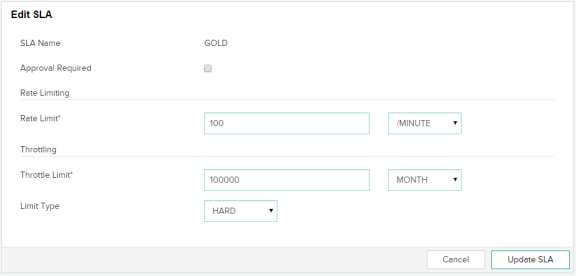
  • View and manage all SLA plans.
  • View and manage tier plans of all published APIs.

Specifying server settings

Specifying security settings

Configuring SLAs


Viewing cluster information

Caching

CF Discovery Server


Notifications

Log

Viewing the analytics dashboards


To the top

Logging in to the administrator portal

To log in to the administrator portal:

  1. Enter the user name and password in the fields provided.
  2. Click Login.
API Manager-Administrator login

If you want to change the password, navigate to <API Manager Installation Directory>/conf and open the file password.properties. Change the password in the file. You can only change the default administrator password using the password.properties file.

Steps to reset admin password:

1. Edit the password.properties file at <apimanager_home/conf>with entries as:
            adminname=<User name while installing API Manager>
            adminpassword=<Your new preferred password>
2. Make readDefault to true in default_conf.xml.
3. Restart "ColdFusion 2016 API Manager" service.

You cannot delete or edit this account to remove administrator privileges.

You cannot change the password of other users except the default user.

To the top

Changing the header logo and title

You can change the logo and title on the header area of the administrator portal.

Navigate to the <API Manager Installation Directory>/wwwroot/portal/conf folder and open the file config.json. Modify the following properties:

{

"headerTitle": "API Manager Portal",

"adminHeaderTitle": "API Manager Administrator",

"headerLogoPath": "images/CF-Logo.png"

}


To the top

Specifying server settings

You can configure the settings for the API Manager server from the following screens:

  • General
  • API Datastore
  • API Analytics Server

General

On this page, you can set up an API Proxy or an API Portal to host your APIs.

API Proxy

In an enterprise, you communicate with existing and new customers. Consumers use a range of devices from phones to desktops. One of the ways to interact with the devices is through an API. But, there are some concerns, for example, security, availability, and monitoring of the APIs. In such situations, you define an API proxy. An API proxy performs the following:

  • Transports security
  • Monitors SLAs, performance, and so on, of the API
  • Defines access levels of an API

An API proxy makes your API independent from your back end services. Whenever you change your back end services, for example, changes in code, the application runs without interruptions.

Setting up an API Proxy

Define API proxy configuration
  1. In the Host field, enter the IP address. The API Proxy can be a host within the network or external to the network.

  2. In the Port field, enter the port of the API Proxy. For example, http://localhost:5100, where 5100 is the port number.

  3. To enable the port on the API Proxy when the proxy restarts (manually or scheduled), select the Enable check-box.

  4. In the Context Root field, enter the name of the context root. A context root identifies an application on the server. For example, if your application's context root is mycontextroot, and the application is hosted on http://localhost:5100, you can access the application at  http://localhost:5100/mycontextroot.

  5. In the AJP Port field, enter the port number of the Apache JServ Protocol (AJP) connector. AJP allows Tomcat to communicate with an Apache web server.

  6. To enable the AJP Port on the server, select the Enable check-box adjacent to the AJP Port field. To save the changes, click Save.

  7. In the Domain URL field, enter the URL of the domain that hosts the API endpoints.

Setting up a Portal

Publishers use portals to create APIs for subscribers to consume. On a portal, a publisher can create the APIs and can restrict the APIs to certain nodes. Portals can run on multiple nodes. On the other hand, you can configure an API proxy on any node.

Define API portal configuration
  1. In the Port field, enter the port of the API Portal.

  2. To enable the port on the API Portal when the proxy restarts (manually or scheduled), select the Enable check-box.

  3. In the AJP Port field, enter the port number of the Apache JServ Protocol (AJP) connector. AJP allows Tomcat to communicate with an Apache web server.

  4. To enable the AJP Port on the server, select the Enable check-box adjacent to the AJP Port field. To save the changes, click Save.

API Datastore

The Datastore is a distributed configuration system and an in-memory cache used in the API Manager. The API Datastore has the following advantages:

  • Distributed
  • Fast
  • Scalable
  • Failsafe

Configuring datastore settings

  1. In the Host field, enter the host name or IP address of the Data store. The Data store can be local or external to a network.

  2. In the Port field, enter the port number of the Data Store.

  3. In the Password field, enter the password of the Data Store.

  4. In the Timeout field, enter the timeout duration in seconds.

API Analytics Server

Configure the settings for the number of API requests for which to generate metrics. For more information, refer to Metrics and Logging.

Configuring metric settings

  1. In the Cluster Name field, enter the name of the cluster. The analytics of these requests are then published into a portal. For more details, refer to Setting up Cluster Support.

  2. In Analytics Server configuration, the client can sniff the rest of the cluster, which adds nodes that the cluster can use. To enable the feature, select Sniff.

    When you select Sniff and specify an Analytic Server address in the configuration, the API Manager finds out the other cluster members and load balances them in a round-robin fashion.

  3. Specify all the node addresses along with the cluster port. To manually add the nodes, click Add Address.

  4. Enter the port numbers in the HTTP Port and Cluster Port fields. The Cluster Port is the location where the API Manager sends the metric data to the Analytic Server. The analytic dashboard fetches the data from the HTTP Port.

  5. In the Flush Interval field, enter the time interval (in seconds). This is the time after which the Analytic Server receives a specified number of API requests.

  6. In the Refresh Interval field, enter the time interval (in seconds). This is the time after which the Analytic server refreshes one or more index.

  7. In the Maximum Actions Per Bulk Request field, enter the number of API requests that are collectively sent to the analytic server for metrics calculation and visualization. If you enter 1000 in the field, no more than 1000 requests can be sent to the server.

    The default value is 1000 actions per bulk request. This means that whenever, 1000 requests are received by the API Manager, a bulk request is dispatched to the Analytics server.  

  8. In the Maximum Concurrent Bulk Request field, enter the number of concurrent blocks of API requests that are sent to the analytic server. For example, if you enter 2 in the field, no more than two concurrent blocks of API requests can be sent to the server.

  9. In the Maximum Volume Per Bulk Request, enter the size of the concurrent requests in this field. The size is calculated in MBs. For example, if you enter 5 in the field, the size of concurrent API requests cannot exceed 5 MB.

To the top

Specifying security settings

Configuration

You can configure the OAuth2 settings on this screen. This protocol allows third-party applications to grant limited access to an HTTP REST service, either on behalf of a resource owner, or by allowing the third-party application to obtain access on its own behalf.

Configuring OAuth2 settings

  1. Click Security > Configuration.

  2. In the Encryption Seed field, enter a random string as new seed value to encrypt application keys, user store connection passwords, and mail server passwords. This string is always a random value.

    Note:

    If you change the encryption seed, restart the API Manager application server.

  3. In the Portal Session Timeout field, enter the number of seconds after which the session of an API publisher or administrator portal application expires.

  4. In the OAuth2 Session Timeout field, enter the number of seconds after which your OAuth2 session gets expires. After the session, you will enter your user name and password for obtaining access tokens and authorization codes.

  5. In the OAuth2 Access Token Default Timeout field, enter the duration of the default OAuth2 access token after which the original access token expires. A subscriber can override this value in the application configuration.

  6. In the OAuth2 Refresh Token Default Timeout field, enter the default OAuth2 refresh token duration after which the ioriginal refresh token expires. A subscriber can override this value in the application configuration.

  7. In the Authorization Code Timeout field, enter the number of seconds after which the OAuth2 authorization code expires.

  8. To allow only HTTPS on OAuth2 and token endpoints, select the Mandate HTTPS check-box. If you select this check-box, you reject plain HTTP connections.

User Store

A user store is a database to store information about users and user roles. The database stores login id, password, first name, last name, email address, and so on.

You can create a user store through LDAP or a database connection, such as, JDBC and ODBC. The API Manager comes with an internal user store. 

To add a user store:

Creating a user store

  1. Click Security > User Store.

  2. Click Add User Store.

  3. From the Connector Type drop-down list, select the type of connector - LDAP Connector or Database Table Connector.

Database Table Connector

You can create a user store using JDBC. You can create a connection string in the database to store the information that an application uses to connect to the database.

Details tab

The Details tab contains the following fields:

Field Description
Name The name identifies the user store.
Logon Identifier The unique identifier for a user store. Prefix this identifier when you log in to a portal.
Description The information about the user store.
Disabled check-box Select to enable users in the store access consumer applications.

Connection tab

The Connection tab contains the following fields:

Field Description
Database Server Name The name of the host from where the database runs.
Database Port The port number of the database server.
Database User Name The name of the user that has permission to a table.
Database User Password The password of the user.
Database Name The name of the database server that contains the table.
JDBC Driver The name of the class of the JDBC driver.
JDBC Connection URL The URL of the JDBC driver. For more information, refer to the JDBC Driver documentation.
Datasource Path The path to the source of JDBC data. For example, jdbc/SampleDataSource.
Initial JNDI Properties The list of JNDI standard environment properties.

Configuration tab

The Configuration tab contains the following fields:

Field Description
User Table The name of the table that contains the user accounts.
Key Column The value of the column that uniquely identifies the rows in the table.
User First Name Column The first name of the user.
User Last Name Column The last name of the user.
User Email Column The email of the user.
Password Column The name of the column in the table that holds the values of the passwords of a user.
Roles Table The name of the table in the database that contain user roles.
Roles Table Key Column The name of the table that contains the mapping between users and their roles.
User Roles Mapping Table User Key Column The value of the column that associates user account in the table.
User Roles Mapping Table Role Key Column The value of the column that associates roles of users in the table.

Pooling tab

The Pooling tab contains the following fields:

Field Description
Maximum Idle Connections The maximum number of connections to the database that can be idle.
Minimum Idle Connections The minimum number of connections to the database that can be idle.
Connection Wait Timeout The time (in milliseconds) that the pool can wait for a connection before it times out.
Maximum Active Connections The maximum number of connections that are allocated from the pool concurrently.
Idle Connection Evict Timeout The time (in milliseconds) to wait before removing an idle connection.

Advanced tab

The Advanced tab contains the following fields:

Field Description
Enable writing empty string Select this check-box to write an empty string instead of a null value in columns defined as not-null in the table schema.
Name Quoting Select this check-box if you want the column names for the database to be within quotes.
Validate Connection Query The SQL query to validate the database connection.

LDAP Connector

You can configure the API Manager to leverage an LDAP server for user authentication. In this case, the LDAP server creates and manages users.

Details tab

The Details tab contains the following fields:

Field Description
Name  The name of the user store. The name identifies this user store.
Logon Identifier The identifier of the user store in LDAP.
Description The information about this user store.
Disabled Select this check-box to enable users in the store access the consumer applications.

Connection tab

The Connection tab contains the following fields:

Field Description
Host  The name or IP address of the LDAP server.
TCP Port The port number of the LDAP server. This port is the same as the port on which the LDAP listens for SSL connections.
User Bind DN The bind Distinguished Name (DN) to connect to the LDAP server. The bind DN is the user on the external LDAP server permitted to search the LDAP directory within the defined search base. The role of the bind DN is to query the directory using the LDAP query filter and search for a user. For example, some possible bind DNs are cn=administrator, cn=Users, dc=domain, or c=com.
User Bind DN Password The password to connect to the LDAP server.
SSL/TLS Enabled Select this check-box to use a secure connection.
StartTLS Enabled Select this check-box to allow an application to send secure requests to an LDAP server.
Base Contexts The points in the LDAP tree for searching the tree.
Failover Servers The name of all the servers that act as failover servers. For example, "ldap://ldap.example.com:389/" represents a list of failover servers. If the primary server fails, Java Naming and Directory Interface (JNDI) connects to the next available server in the list.

Configuration tab

The Configuration tab contains the following fields:

Field Description
User Configuration The object classes for creating user objects in LDAP. An object class represents the type of data  in an LDAP. An objects class contains attributes of an entry in an LDAP. An objectclass is defined in a schema.
LDAP Filter for Retrieving Accounts The filter attribute to retrieve user accounts from LDAP.
Account User Name Attributes The attribute or attributes that represent a user name of an account. An attribute authenticates a user name in an LDAP entry.
User First Name Attribute The attribute that represents the first name of the user in an LDAP account.
User Last Name Attribute The attribute that represents the last name of the user in an LDAP account.
User Email Attribute The attribute that represents the email of the user in an LDAP account.
Group Configuration The object classes for creating groups in LDAP.
LDAP Filter for Retrieving Groups The filter attribute to retrieve user groups from LDAP.
Group Name Attribute The attribute that represents the name of the group in an LDAP account.
Group Membership Attribute The attribute that contains users in an LDAP group.

Advanced tab

The Advanced tab contains the following fields:

Field Description
Use Paged Result Control

Select this check-box to ensure that the LDAP uses paged results instead of Virtual List View (VLV) when retrieving user accounts. VLV lets you query a large directory in chunks. For example, let there be a directory with a large number of users, "ou":

dc=demo,dc=local         

     + ou=DemoGroups (100,000 groups)         

     + ou=DemoUsers (100,000 users)

If you want to present the information in the user group "ou" in a scrollable or paged window in an application, retrieving 1000 pages of 100 results each is an inefficient way. This method is resource-intensive and wastes bandwidth. On the other hand, VLV queries a large data-set with a sorting rule. For example, using VLV, you can sort the first 50 users ordered by organizationName in an LDAP.

LDAP Referral Handling Either follow or ignore LDAP referrals. LDAP referrals enable an LDAP tree to be distributed across multiple LDAP servers. Therefore, an LDAP server can reference other LDAP servers even though it does not store the full Directory Information Tree (DIT). When you browse a particular directory, an LDAP server returns referrals after referring you to another server in the tree.

Adding users

User management in the API Manager involves defining and managing users, roles, and their access levels. You can add or delete users, assign roles, search for users, manage user stores, and import external users from LDAP or database connection.

To add a user:

  1. Click Security > Users

  2. Click Import External Users to retrieve users from a database or an LDAP connection.

  3. To add a user, select a user store and click Add User. The following page displays.

    1. In the User Name field, enter the unique identifier of the new user.
    2. Enter the attributes of the user in the rest of the fields.
    3. Select the appropriate role for the new user- Publisher, Subscriber, or Administrator. For more details, see Roles.
    4. Click Add User to add the user in the user store.
To the top

Configuring SLAs

In the API Manager, an application or a resource can be available to a consumer at different levels of service. SLA configuration enforces access control through rate limiting and throttling.  Throttling tiers limit the number of hits to an API over a certain time, due to monetization of the API, security restrictions, infrastructure issues, and so on.

For example, you can set throttling tiers to the APIs to limit access to it accordingly. Each tier defines a maximum number of requests per day or week or month.

You can also set the rate limit for an SLA per second or minute or hour.

You can then add your own tiers to the API Manager using the instructions below:

Adding an SLA

  1. Click SLA Configuration. The following page displays.

  2. Select the rate limiting algorithm. In API manager, two types of algorithms can be used to limit the rate: Rolling and Fixed.

    In fixed window algorithm, the period is considered from the starting of the time unit to the end of the time unit. For example, a period is considered as 0-60 seconds for a minute irrespective of the time frame at which the API request has been made.

    In rolling window algorithm, the period is considered from the fraction of the time at which the request has been made to the end of the time unit. For example, if two requests for API calls are made at 30th second and 40th second of a minute it is considered as two requests from 30th second of that minute up to the 30th second of next minute.

    For more details, refer to Rate-limiting.

  3. In the SLA Name field, enter the name of the new SLA.

    In the Rate Limit field, enter the API request rate limit in the SLA. You can only limit an API request rate to number of requests per second, minute, or hour.

    In the Throttle Limit field, enter the API throttle limit in the SLA. You can only limit an API request rate to number of requests per second, minute, or hour.

    Select the type of throttle limit- Hard or Soft.

    • Hard: If you select this option, the number of API requests cannot exceed the throttle limit.
    • Soft: If you select this option, you can set the API request limit exceed a percentage. For example, if you set the Exceed Limit to 90%, the number of API requests can exceed 90% of the prescribed limit.
  4. In the Notify Limit field, enter the limits (in percentage) at which you receive notifications when the number of API requests approach the limit.

  5. In the Exceed Limit field, enter the limits (in percentage) by which the number of API requests can exceed.

  6. If the SLA requires an approval from the API publisher, select the Approval Required check-box.

Editing an SLA

You can edit an SLA and modify its properties. Choose an SLA from the Existing SLAs list.

  1. Click Edit. The following page displays.

  2. Update all the properties of the SLA and click Update SLA.

To the top

Viewing cluster information

You can see a list of all clusters configured in API Manager. You can also see a cluster's proxy port, portal port, and so on.

To the top

Caching

Set the maximum response size to define the maximum size, in bytes, of the response that can be stored in the output cache. Also specify the timeout, in seconds.

To the top

ColdFusion discovery server

If you want to discover REST services published in a ColdFusion non-InVM environment, configure the ColdFusion server on the CF Discovery Server Configuration page.

  1. In the Protocol drop-down list, select HTTP or HTTPS.

  2. In the Name field, enter the name of the ColdFusion server.

  3. In the Address field, enter the host and port number of the CF server.

  4. In the Context field, enter the REST servlet context of the CF server.

  5. In the Username and Password fields, enter the credentials to log in to the ColdFusion server.

To the top

Configuring notifications

The API Manager sends notifications for any alerts or user events that require attention. You can configure the settings for email notifications for publishers and consumers.

Configuring mail settings

  1. Click Notifications > Mail. The following page displays.

  2. In the Mail Server field, enter the name of the server that sends Simple Mail Transfer Protocol (SMTP) messages. Alternatively, you can enter the mail server (for example, mail.company.com) or the IP address of the mail server (for example, 127.0.0.1).

  3. In the Port field, enter the port number of the mail server.

  4. In the Username and Password fields, enter the credentials to authenticate a user in the mail server.

  5. In the Timeout field, enter the time (in seconds) that the API Manager waits for a response from th email server.

  6. In the Protocol field, enter the messaging protocol for the mail server, for example, SMTP.

  7. To enable Transport Level Security (TSL) on the connection to the mail server, select the Enable TLS connection to mail server check-box. Transport Layer Security (TLS) is a protocol that ensures privacy between applications and their users within a network. When a server and client communicate, TLS ensures security of the communication.

To the top

Configure log

In this page, choose the modules for which you want to generate debug logs. For example,

  • Messages logged during startup, shutdown, and cluster updates.
  • Messages logged when a request is dispatched.
  • Messages logged when an API resolves a request.

You can enable debugging for specific sections that you want to debug. For example, if you want to check for any issues while creating an API, enable the Publisher check-box in the Portal section.

This way you can manage your debug logs properly.

To the top

Viewing the analytics dashboard

Analytics dashboard helps you view the number of APIs that are run from a node, the number of API requests, and system statistics. The API Manager collects information as APIs process information. If you see a sudden spike on a graph or chart, you can take immediate measures.

By clicking a particular data (for example, API name or Publisher name or field in graph), you can filter the entire dashboard on that field.

Click Analytics to display the dashboard.

There are three types of dashboards in the Administrator portal: 

  • Home
  • Publisher APIs
  • Publishers

Home: On the Home dashboard panel, you can see the following dashboards:

Request Count for Nodes

You can view the node IP and port on which an API runs. You can also view the number of requests by the API. Hover the pointer on the visualization to see the details.

Total Request Count

You can view the count of requests by an API.

Consumed Metrics

You can view the avarage response time (in milliseconds) of an API, and the average incoming and outgoing data (in KB) of the API.

Average Request Count

You can view a line graph of the count of API requests. You can further filter the data according to the time range, for example, today, this week, this month, last minutes, last 30 minutes, last 5 years, and so on. Hover the pointer on an point on the axis to view the number of API requests within the time range.

Average Response Time

You can view the average response time of an API using this visualization. This time is in milliseconds. You can filter the data according to a time range.

Publisher APIs: On the Publisher APIs dashboard, you can see the details of each API from a publisher, the number of APIs, the number of publishers, the response times for APIs, and so on.

You can filter the requests and whole dashboard on the publishers.

Hover the pointer on a pie chart or a line chart to view more details.

1 Pie-chart for the number of API requests by publishers.
2 The number of API requests by a publisher.
3 The number of API requests.
4 The number of APIs.
5 The number of nodes in a cluster that contains the APIs.
6 The number of publishers.

Publishers: On the Publishers dashboard, you can see the visualization of the number of API requests, the number of publishers, average data consumption per publisher, and so on.

You can filter the requests and whole dashboard on the publishers.

Hover the pointer on a pie chart or a line chart to view more details.

1 Pie-chart for the number of API requests by publishers.
2 The number of nodes in a cluster that contains the APIs.
3 The number of API requests.
4 The unique count of publishers that have made at least one request within the time range.
5 The number of API requests from all publishers.
6 The number of API requests by publishers according to time-range.

Creating a visualization

You can create your custom visualizations and save it for further analysis. Follow the steps below to create a visualization:

  1. To create a visualization, click the Visualize tab.

  2. You can create visualizations in the form of area charts, data table, pie charts, and so on, from API information. As an example, create an area chart from the API analytics. Click Area chart from the list.

  3. Select from the following:

  4. Create a visualization from a new search. Select From a new search. You can see the following index patterns in the drop-down list:

  5. Select the data point on the X-Axis and click Apply.

An area chart displays with number of API requests on the Y-axis and API time-stamp on the X-axis.

Filtering data according to time range

In the Analytics page, you can filter the results according to a time range.

There are three ways options:

  1. Quick
  2. Relative
  3. Absolute
  1. Click the time filter as shown below:

  2. Select any time range from the list, as shown below:

    If you select Today, you can see the analytics of all APIs for the last 24 hours.

  3. Click Relative. You can filter the data from a specified date and time to the current date and time.

  4. Click Absolute. You can filter the results according to dates.

Filtering data according to fields

You can filter the dashboard according to fields and get complete analytic report of an API's activity. When you apply a filter, the dashboard changes accordingly and you can view the graphical results.

To filter dashboard information according to fields:

  1. Click any dashboard type:

    • Home
    • Publisher APIs
    • Publishers
  2. Choose any dashboard and hover your mouse on the graph to view the field and its values. The snapshot below displays the field values for the request count for all publisher APIs within a particular time:

    You can see a table that lists all field values for the API usweather and the number of times the API is called.

  3. Click the graph. You can see a new dashboard listing all the attributes of the chosen API.

This work is licensed under a Creative Commons Attribution-Noncommercial-Share Alike 3.0 Unported License  Twitter™ and Facebook posts are not covered under the terms of Creative Commons.

Legal Notices   |   Online Privacy Policy

Choose your region United States (Change)   Products   Downloads   Learn & Support   Company
Choose your region Close

Americas

Europe, Middle East and Africa

Asia Pacific

  • Brasil
  • Canada - English
  • Canada - Français
  • Latinoamérica
  • México
  • United States
  • Africa - English
  • Österreich - Deutsch
  • Belgium - English
  • Belgique - Français
  • België - Nederlands
  • България
  • Hrvatska
  • Cyprus - English
  • Česká republika
  • Danmark
  • Eesti
  • Suomi
  • France
  • Deutschland
  • Greece - English
  • Magyarország
  • Ireland
  • Israel - English
  • ישראל - עברית
  • Italia
  • Latvija
  • Lietuva
  • Luxembourg - Deutsch
  • Luxembourg - English
  • Luxembourg - Français
  • Malta - English
  • الشرق الأوسط وشمال أفريقيا - اللغة العربية
  • Middle East and North Africa - English
  • Moyen-Orient et Afrique du Nord - Français
  • Nederland
  • Norge
  • Polska
  • Portugal
  • România
  • Россия
  • Srbija
  • Slovensko
  • Slovenija
  • España
  • Sverige
  • Schweiz - Deutsch
  • Suisse - Français
  • Svizzera - Italiano
  • Türkiye
  • Україна
  • United Kingdom
  • Australia
  • 中国
  • 中國香港特別行政區
  • Hong Kong S.A.R. of China
  • India - English
  • 日本
  • 한국
  • New Zealand
  • Southeast Asia (Includes Indonesia, Malaysia, Philippines, Singapore, Thailand, and Vietnam) - English
  • 台灣

Commonwealth of Independent States

  • Includes Armenia, Azerbaijan, Belarus, Georgia, Moldova, Kazakhstan, Kyrgyzstan, Tajikistan, Turkmenistan, Ukraine, Uzbekistan

Copyright © 2016 Adobe Systems Incorporated. All rights reserved.

Terms of Use | Privacy | Cookies

AdChoices