Analyze a render graph
There are several ways to analyse a render graph:
Use the Render Graph Viewer
To open the Render Graph Viewer window, go to Window > Analysis > Render Graph Viewer.
The Render Graph Viewer window displays a render graph, which is the optimized sequence of render passes the Universal Render Pipeline (URP) steps through each frame. The Render Graph Viewer displays both built-in render passes and any custom render passes you create.
Refer to Render Graph Viewer window reference for more information on the Render Graph Viewer.
View a render graph
The Render Graph Viewer window displays the render graph for the current scene by default. To select another render graph, use the dropdown in the toolbar.
Example: check how URP uses a resource
You can use the resource access blocks next to a resource name to check how the render passes use the resource.
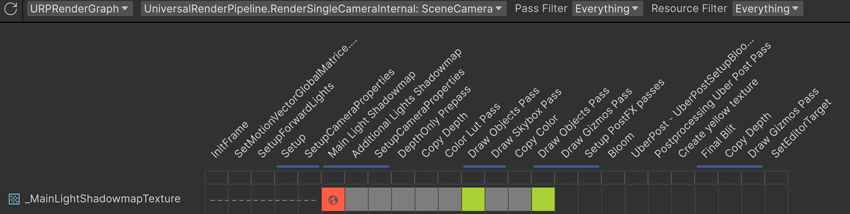
In the previous example, the _MainLightShadowmapTexture_ texture goes through the following stages:
During the first five render passes between InitFrame and SetupCameraProperties, the texture doesn't exist.
The Main Light Shadowmap render pass creates the texture as a global texture, and has write-only access to it. Refer to Transfer textures between passes for more information about global textures.
The blue merge bar below Main Light Shadowmap means URP merged Main Light Shadowmap, Additional Lights Shadowmap and SetupCameraProperties into a single render pass.
The next five render passes don't have access to the texture.
The first Draw Objects render pass has read-only access to the texture.
The next two render passes don't have access to the texture.
The second Draw Objects render pass has read-only access to the texture.
Check how URP optimized a render pass
To check the details of a render pass, for example to find out why it's not a native render pass or a merged pass, do either of the following:
- Select the render pass name to display the details in the Pass List.
- Below the render pass name, hover your cursor over the gray, blue, or flashing blue resource access overview block.
Refer to Render Graph Viewer window reference for more information.
Use the Rendering Debugger
You can use the Rendering Debugger to log the resources URP uses and how it uses them, in the Console window.
To enable logging, follow these steps:
- Select Window > Analysis > Rendering Debugger to open the Rendering Debugger window.
- In the left pane, select the Render Graph tab.
- Enable Enable Logging.
- Select either Log Frame Information to log how URP uses resources, or Log Resources to log details about the resources.
- Select the new item in the Console window to display the full log.
Refer to Rendering Debugger for more information.
Use the Frame Debugger
Use the Frame Debugger to check the render passes and draw calls in the rendering loop.
The Frame Debugger displays the following in the Event Hierarchy panel when the render graph system is active:
- A parent rendering event called ExecuteRenderGraph.
- Child rendering events called (RP <render-pass>:<subpass>), where
<render-pass>is the render pass number and<subpass>is the subpass number.
The Frame Debugger shows only render passes that contain a draw call.
Refer to Frame Debugger for more information.