Remote Debugging Tools
This section shows how to use standard Web Inspector tools available from the https://build.phonegap.com to debug PhoneGap apps while they are running on your device. See the PhoneGap Build section for details on how to provide the site with project code, and how to get the resulting compiled apps onto your device.
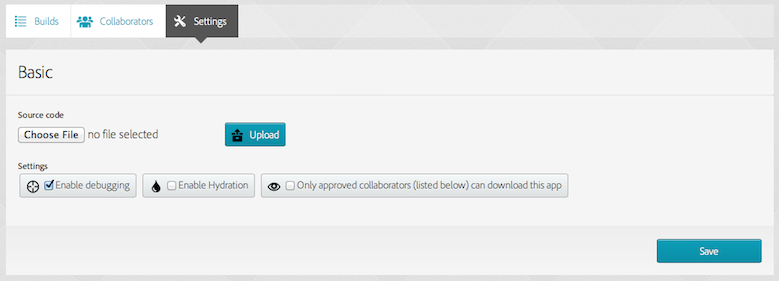
To enable debugging from within the list of existing Apps, click on the name of the application to view its details. Click on the Settings tab, then select the Enable debugging check box:
Once the debugging option is selected and you build the project, the Debug button appears along with other options to update code and rebuild the project. When you preview the app on the device, perhaps by scanning the QR code as described in Introducing PhoneGap Build, pressing Debug opens a web page that allows you to communicate with the app as it runs on the device:
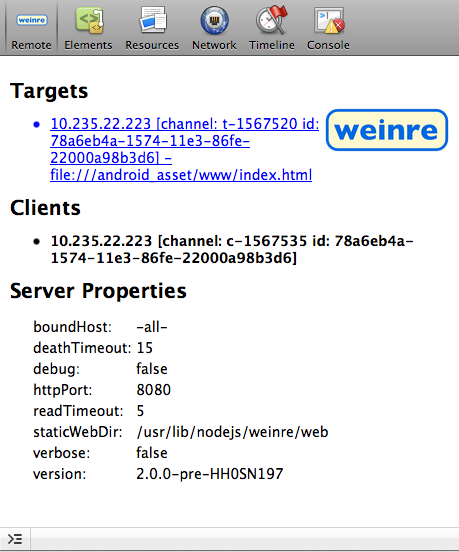
Pressing the listed target gives you access to the app's internal state. The debugger may occasionally lose its connection if you pause the app or if the device goes into a standby mode. In that case, the Remote tab may present a new target with which to re-establish the connection.
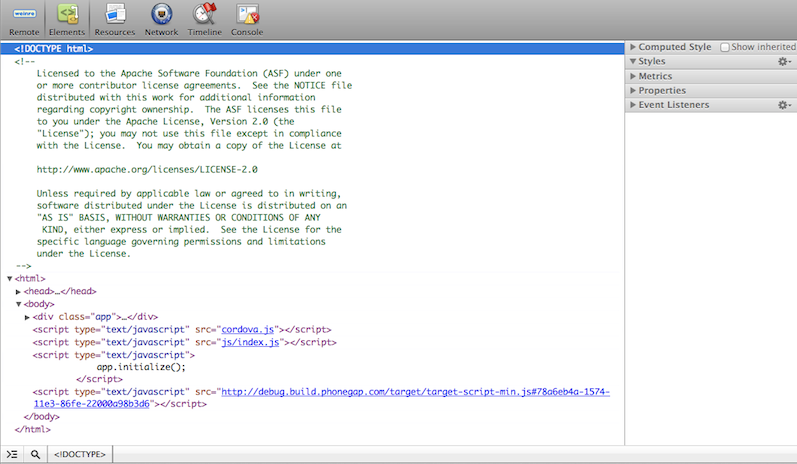
Once connected, the Elements tab allows you to view the app's full DOM tree as it executes:
You can use this interface to modify the application as it runs. For example, the default PhoneGap app generated by the CLI (see The Command-line Interface) presents a slowly blinking status message beneath the icon:
Selecting various elements from the DOM tree in the debug view highlights them on the device if visible, which may help you locate the relevant code:
<div id="deviceready" class="blink">
The sidebar on the right allows you to view information about CSS
properties applied to each element and the selectors that specify
them. If you double-click on the class attribute and delete the
blink text, the message stops blinking on the device, and the
.blink selector disappears from the sidebar's Matched CSS Rules:
    .blink {
        -webkit-animation: fade;
        -webkit-animation-delay: initial;
        -webkit-animation-direction: initial;
        -webkit-animation-duration: 3000ms;
        -webkit-animation-fill-mode: initial;
        -webkit-animation-iteration-count: infinite;
        -webkit-animation-name: fade;
        -webkit-animation-timing-function: initial;
    }
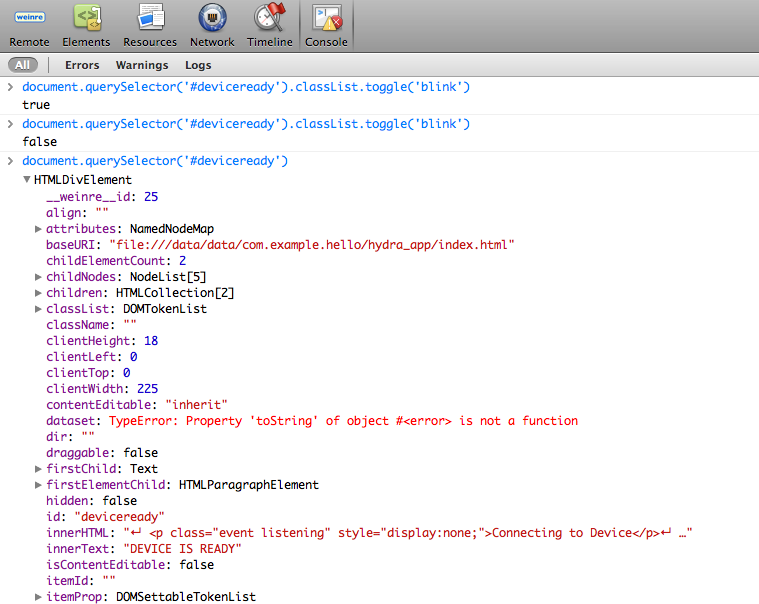
To see the same change without editing the DOM, select the Console
tab and type a JavaScript call directly onto the command line. This
example selects the element whose id is deviceready and turns on
or off its blink class:
document.querySelector('#deviceready').classList.toggle('blink')
The method's return value displays within the console. Typing the name of any object allows you to view its evaluated contents:
The browser engine's error messages and results of console.log()
calls also appear on the console.
Navigating back to the Elements view displays the results of the change, but note there may be a delay, and you may need to re-select the DOM node to view its current state.
The Web Inspector offers several other useful features:
The Network tab lists details on network requests the app makes while executing, along with a timeline interface to visualize a progression of network interactions.
The Timeline tab similarly visualizes load times for the app's component resources.
The Resources tab allows you to inspect cookies and the contents of various client-side databases (
localStorage,sessionStorage, Web SQL) set by the Storage API. Note that this view also allows you to inspect the HTML5 Application Cache, which allows you install an app persistently from a set of network resources. However, this feature is less appropriate for PhoneGap apps, which are already delivered to the device as part of an installed native package.
Despite slight differences in how Web Inspector features appear in different WebKit-based browser environments, the documentation for Google Chrome and Apple Safari provides a good overview.
Configuring a Custom Debug Server
To enable debugging, PhoneGap Build relies on a tool called Weinre,
which runs on a debug.build.phonegap.com server by default. This
section shows how to run it on your own local server. Setting it up
on a public server is possible, but requires additional setup outside
the scope of this section.
You must have the npm utility already installed. Then run the
following to install Weinre:
sudo npm -g install weinre
The following gets Weinre up and running, and displays details on the debug server:
    $ weinre
    2013-07-01T20:03:34.890Z weinre: starting server at http://localhost:8080
The application needs to be made aware of the debug server. To obtain
the IP address of the machine running Weinre, run ipconfig on
Windows or ifconfig on OSX/Linux. Then add the following, along with
the IP address and a unique key, to the app's config.xml file:
    <feature name="debug-server" required="true">
      <param name="domain" value="[ IP number ]"/>
      <param name="key" value="[ a unique id for your app ]"/>
    </feature>
You can now use your local server to debug an app. If your router
runs NAT, you may need to access the server via the 8080 port:
http://[ip address]:8080.
For more configuration options, see The config.xml File and PhoneGap Build Configuration.