Debugging lets you examine and troubleshoot your application. When you debug, you can control when the application must stop at specific points in the code. You can also monitor important variables and test your code. Debugging uses a configuration to control how applications are launched. When you debug your application, you run the debug version of the application file.
Using ColdFusion debugger
Before you use the ColdFusion Debugger, ensure that you do the following:
Set up ColdFusion to use the Debugger
Before you use the Debugger, ensure the following:
- A server is associated with the project or the project containing the files that you want to debug.
- In the Navigator view, right-click the project and select Properties.
- In the Properties dialog box, select ColdFusion Server Settings.
- Under Select Servers, ensure that a server is selected. If no server is selected, select the Servers drop-down list and select an available server, or select Add Server to configure a new server.
- RDS is enabled on the ColdFusion server, and you have specified the correct RDS configuration information in ColdFusion Builder.
- Debugging is enabled in ColdFusion Administrator.
- In ColdFusion Administrator, select Debugging & Logging > Debugger Settings.
- Select Allow Line Debugging.
- Specify the port to use for debugging. The default value is 5005.
- Specify the maximum number of simultaneous debug sessions. The default value is 5.
- Click Submit Changes.
- To increase the time after which requests time out, do the following:
- Select Server Settings > Settings.
- Select Timeout Requests After (Seconds) and enter the required timeout value. For example, 300.
- Click Submit Changes.
The debugger server listens for commands from ColdFusion Builder on a separate port than the one specified in step 3. By default, ColdFusion launches the debugger server with a random available port. This could be a problem if ColdFusion (and hence debugger server) is behind a firewall. Because, the firewall blocks the random port that the debugger is listening. To prevent this problem, specify a fixed debugger server port number and allow this port in the firewall. To set a fixed debugger server port number, specify the following JVM argument on the Java And JVM page of the ColdFusion Administrator (or the appropriate place for your J2EE Application Server). Replace portNumber with the port that you want to use:
-DDEBUGGER_SERVER_PORT=portNumber
- Restart ColdFusion. If you are running the J2EE configuration of ColdFusion, restart the server in debug mode with the debug port as specified.
Set up debugging for J2EE configuration of ColdFusion
If you are not running the server configuration of ColdFusion, specify Java debugging parameters in the configuration file or startup script of the application server you are running. The parameters must look like the following:
-Xdebug -Xrunjdwp:transport=dt_socket,server=y,suspend=n,address=<port_number>
Ensure that the port number you specify is the same port number specified on the Debugger Settings page of ColdFusion Administrator.If you are running the server configuration, ColdFusion writes these debugging parameters to the jvm.config file when you use the Debugger Settings page of the ColdFusion Administrator.
- If you are not running the server configuration and your application server is not running on JRE 1.6, copy the tools.jar file of the JDK version that your application server is running to the \lib folder of ColdFusion. For example, if you are running JRun that runs on JRE 1.4, copy the tools.jar file of JDK 1.4 to the \lib folder of ColdFusion.
- If you are running the server version of ColdFusion and you specify a JRE version other than JRE 1.6 in the jvm.config file, copy the tools.jar file of the JDK version specified in your jvm.config file to the \lib folder of ColdFusion.
Specify debugger settings in ColdFusion Builder
- In ColdFusion Builder, select Window > Preferences.
- In the tree view, select ColdFusion > Debug Settings.
- Specify the home page URL that points to the page that appears in the Debug Output Buffer of the debugger when you click the Home button.
- Specify the extensions of the types of files that you can debug and debugger scopes that you want the Debugger to recognize. To improve performance when debugging large files, deselect all scopes for which you do not require information.
- Select Break On CFML Runtime Exception to stop the debugger on the line that causes a ColdFusion error.
- Select Log An Exception To The Eclipse Error Log to display the server logs in the TailView view instead of showing a warning dialog.
Debugging your application
After you enabled the debugger in the ColdFusion Administrator and configured the debugger in ColdFusion Builder, you can debug projects in ColdFusion Builder.
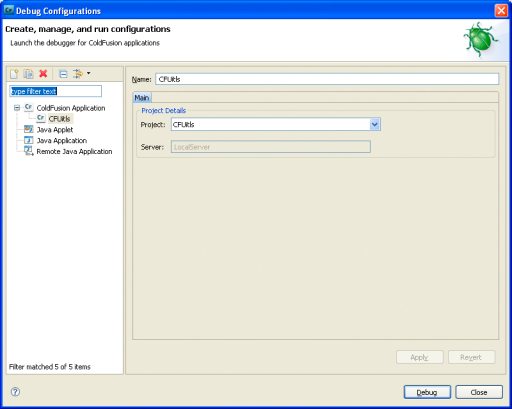
Create or edit launch configurations
When you debug a project in your application, ColdFusion Builder creates a project-specific launch configuration for the first time that you debug. The launch configuration automatically defines a project name (based on the project that you are debugging), main application file, and the path to debug the application.
Launch configurations are managed through the Create, Manage, and Run Configurations dialog box.
 in the workbench toolbar.
 represents this type of breakpoint.